Why is mechanical testing important? It is a simple question, and the simple answer is that everything is made from something, so it is essential that the materials that we use are fit for purpose, safe to use, appropriate for their intended application, and compliant with regulations. If they are not, then it can be mildly annoying (like when the screen on your iPhone breaks) or it can potentially be fatal (like when an aeroplane engine component suffers a mid-air failure). Understanding mechanical properties and having the means and methods to measure them is, therefore, extremely important. Here at Plastometrex we are developing novel mechanical testing methods to make mechanical testing quicker, simpler, and more insightful.
Understanding Mechanical Properties
The most commonly measured mechanical properties are the stiffness, strength, ductility, toughness, and hardness, but what exactly are these properties? Our own experience is that these terms are often confused and even when they are not confused there are some subtleties that tend to get lost and these can be very important when it come to interpreting materials testing data. This blog article is geared towards clarifying some of these points.
The first two properties we cover in the article are stiffness and strength, and we do this with reference to a metallic stress-strain curve. Now most people are familiar with with the tensile test and universal mechanical test machines, in which a test coupon (shown in blue in the image) is stretched, or strained to use the correct term, and while being stretched the forces that are needed to stretch it are being continuously monitored. A key feature of these tests, perhaps a little more subtle, is that the stresses and strains that develop within the central section of the specimen are (1) uniform – i.e. take the same value, and (2) uniaxial – i.e. oriented in one direction along the testing axis. When you do such a test a number of features become apparent and the first place I want you to focus your attention is section A on the graph, which is the region represented by a straight line – because in this region the material is being stretched (or strained, rather) but in a way in which the stresses and strains are related to each other in linear fashion. And that relationship continues to hold until the stresses reach point B. Beneath the stress at point B the material is deforming elastically, which simply means that the material will recover its initial shape if the load being applied is removed. The gradient of that linear part of the graph represents the stiffness of the material – or its elastic modulus – which can therefore be defined as a materials elastic resistance to applied forces.

The next location to focus your attention is at Point B, and this is the stress at which the material begins to deviate from elastic behaviour to plastic behaviour (otherwise known as the yield strength) such that the material will no longer return to its original shape once the load has been removed (we perhaps all have an intuitive sense of what this means because we have all at some time or another bent a spoon or another piece of metal into a new shape, but what we might not have understood at that time was that the material we were distorting did at some locations contain stresses that were in excess of the stress at point B so that it yielded and permanently changed its shape).
Now the second relevant location on the stress-strain graph from a strength definition point of view is the ultimate tensile strength which is basically the maximum nominal stress that was reached during the tensile test, although it’s worth noting that it’s not always very well defined and sometimes a plateau in this region is observed. Anyway, before we settle on the definitions for strength it is important to highlight what is going on between point B and C because during this stage the tensile test specimen is straining but it is doing so uniformly, which really just means that as the specimen gets longer, the cross-sectional area is getting smaller too, but it is doing so uniformly – i.e. the cross-sectional area is the same all the way down the length of the coupon.
Once we reach the UTS though, things begin to change, and the test specimen actually starts to neck, and you can see an example in the insert image; at this point the stresses and strains within the specimen are no longer uniform and uniaxial – they are much more complex than this and interpretation of the curves becomes more difficult as the material is now heading fast towards its final failure stage.

So, from that simple analysis of the stress-strain curve we can begin to draw a definition for the strength of a material, and in fact it is possible to define two, one being a material's ability to withstand loads without plastically deforming – that’s the yield strength, and one being a materials ability to withstand loads without beginning to fail – which is the ultimate tensile strength.
Ductility
Now ductility, which is a property that gets cited very heavily as it is related to fracture of the material, so assumes a high importance. The ductility is a measure of a material’s ability to withstand plastic deformation before failure, so is about the degree of tolerable strain. However, what is less well known and understood is that ductility is not a fundamental material property like, for example, the yield stress is. The ductility that is measured in a normal tensile test actually varies if you change the dimensions of the test coupon. This is not always appreciated yet it is extremely important. Some real experimental data are shown in the graph, from tests conducted on the same material, showing that the ductility value falls as the specimen aspect ratio increases – the curves are actually almost coincident up to the UTS, as they should be, but once necking in the specimen starts the aspect ratio has a significant effect on the measured test outcome. When people therefore cite a ductility value it is often totally meaningless – if you search the literature looking for ductility values of a particular alloy and there is no information about the test specimen dimensions then that information is also meaningless. The only real way that a ductility value can be used is to rank different materials that have been tested using the exact same specimen dimensions. Otherwise, ductility values are of very limited engineering utility, so be warned!

Toughness
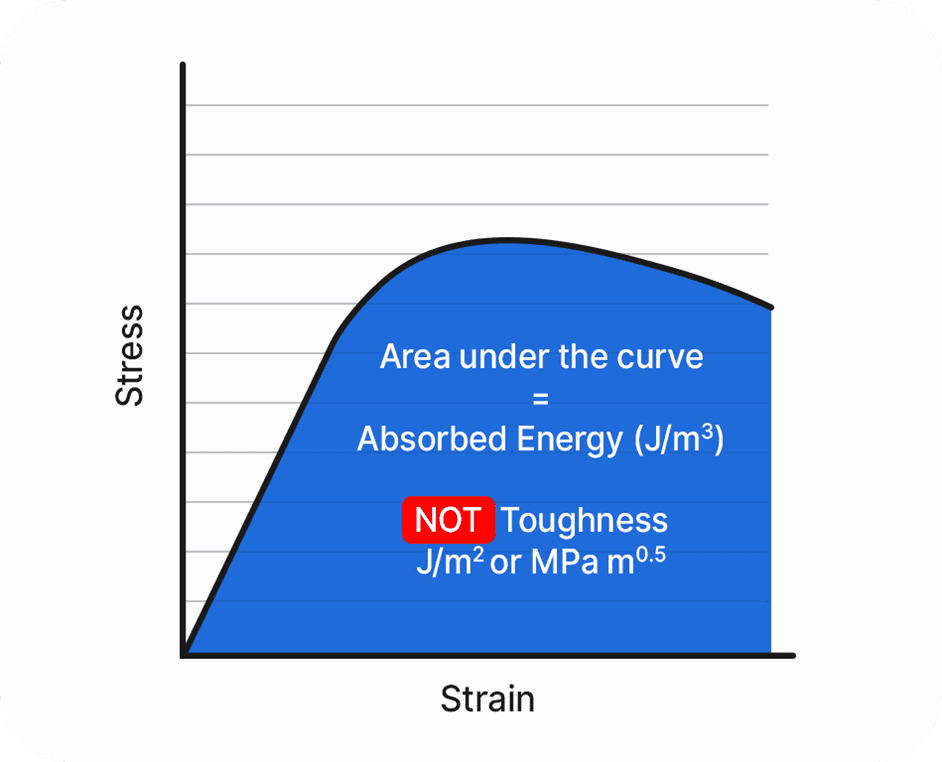
So what can we therefore say about toughness? Well, it is helpful here (necessary, even) to quash another common misunderstanding which is that the area under the stress-strain curve is equal to the toughness of the material – this is incorrect, and one way of confirming this is to simply compare the units of toughness (which can be expressed in two slightly different ways – either J/m2 or MPa root metre) with the units of the area under the curve – which is J/m3. It is clear that the two are dimensionally inconsistent – the definition of toughness is a materials resistance to crack propagation – whereas in the stress-strain curve above there is a load of uniform plastic straining taking place between the yield stress and the UTS, and this is not plastic work that can be associated with crack propagation so this area cannot be considered to be a true measure of the material toughness. It is not totally meaningless though (like ductility almost is) – if the area is large, then this does imply that a material will be tougher, so there is a correlation between this area and the toughness, but it fundamentally is not the toughness and it is worth clearing this up in this article.
Hardness
Hardness is defined as a material’s resistance to plastic deformation, and since we are now familiar with the stress-strain curve we can understand this definition in view of what we know about the yield stress and the hardening behaviour that is highlighted in the plot below. If hardness is resistance to plastic deformation, then materials with high hardness tend to have high yield stress values and/or high work hardening rates – which is the rate at which the stress approaches the UTS in the stress-strain curve. The hardness number is therefore closely related to the stress-strain curve, but what you cannot do is calculate a stress-strain curve from a hardness number! Anyway, most people are familiar with hardness testing since it simply involves pushing a hard indenter into a less hard material and measuring the diameter or diagonal of the resulting indent. In fact, hardness tests have been around for hundreds of years, and it is a very simple test – it is also very quick – you can test real components and you can spatially map hardness changes over a component or a welded region. The problem though with hardness numbers is that they are not fundamental material properties – the hardness number of a material changes if you change the shape of the indenter or the load that you apply so hardness numbers can only really be used in a semi-quantitative way to rank materials.


