This blog post explains how necking, a localised narrowing of a sample, occurs during tensile testing of metals due to the interplay between work hardening and strain. It also details the Considère construction, a method to predict the onset of necking based on the material's stress-strain curve.
Fracture During Tensile Testing
With a brittle material, tensile testing often gives an approximately linear stress-strain plot, followed by fracture (at a stress affected by the presence and size of flaws). However, most metals do not behave like this and are likely to experience considerable plastic deformation before they fail. Initially, this is likely to be uniform throughout the gauge length. Eventually, of course, it will fail (fracture). However, in most cases, failure will be preceded by at least some necking. The formation of a neck is a type of instability, the formation of which is closely tied in with work hardening. Once a neck starts to form, the (true) stress there will be higher than elsewhere, possibly leading to more straining there, further reducing the local sectional area and accelerating the effect.
Necking and Work Hardening
In the complete absence of work hardening, the sample will be very susceptible to this effect and will be prone to necking from an early stage. Work hardening, however, acts to suppress necking, since any local region experiencing higher strain will move up the stress-strain curve and require a higher local stress in order for straining to continue there. Generally, this is sufficient to ensure uniform straining and suppress early necking. However, since the work hardening rate often falls off with increasing strain, this balance is likely to shift and eventually render the sample vulnerable to necking. Furthermore, some materials (with high yield stress and low work hardening rate) may indeed be susceptible to necking from the very start.
The Considère Construction
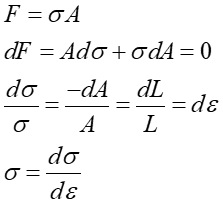
This situation was analysed originally by Armand Considère (1885), in the context of the stability of large scale structures. Instability (onset of necking) is expected when an increase in the (local) strain produces no net increase in the load, F. This happens when

This leads to:
Necking is thus predicted to start when the slope of the true stress / true strain curve falls to a value equal to the true stress at that point (Fig. 1).
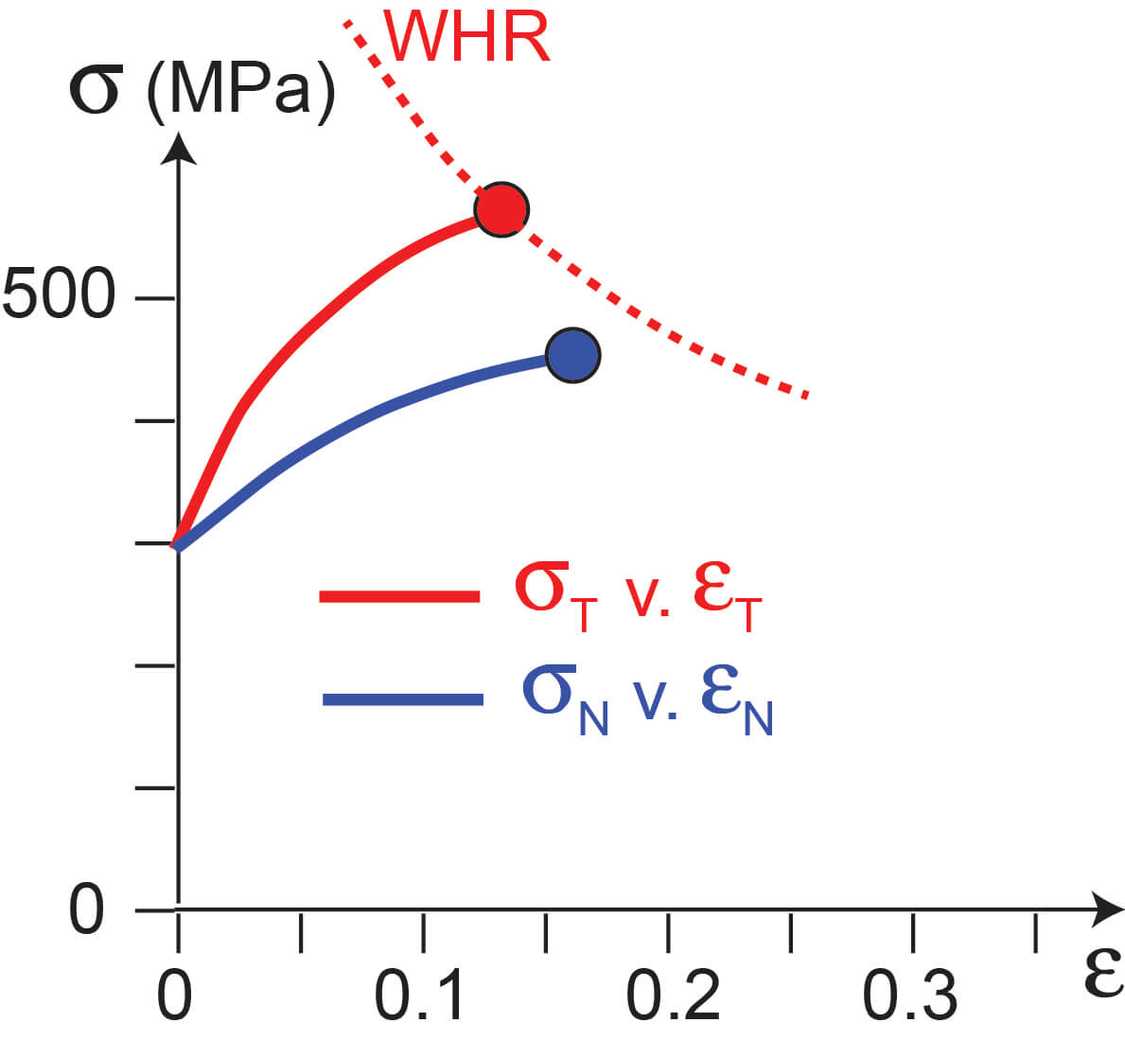
This condition is commonly expressed in terms of the nominal strain.
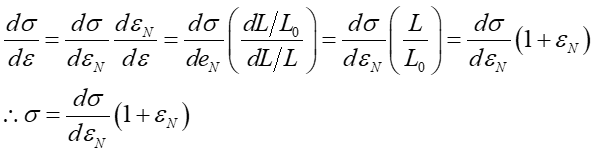
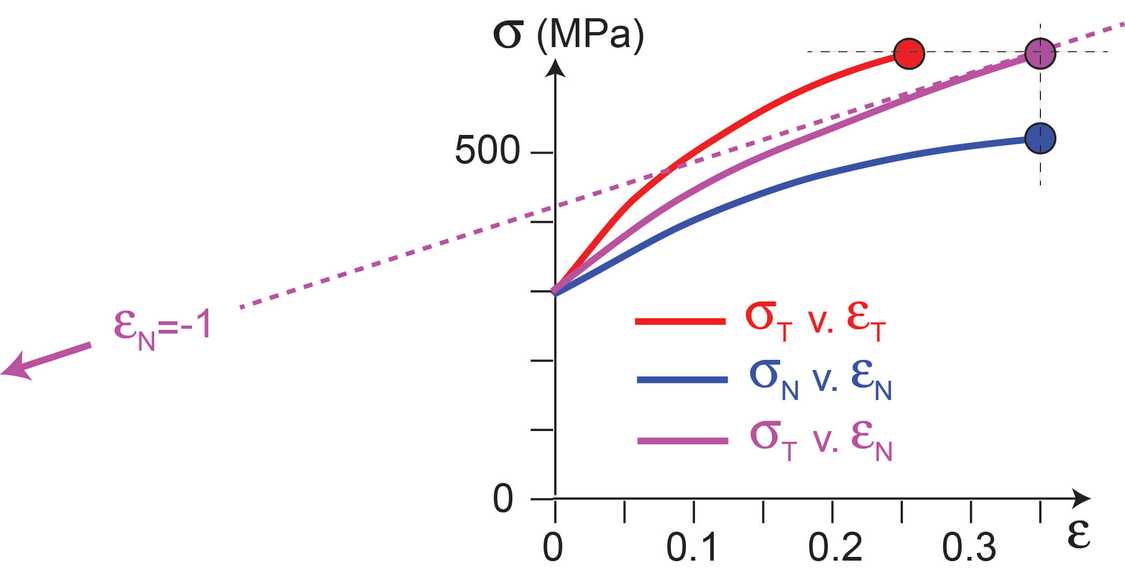
The condition can therefore also be formulated in terms of a plot of true stress against nominal strain. On such a plot (Fig. 2), necking will start where a line from the point eN = -1 forms a tangent to the curve.
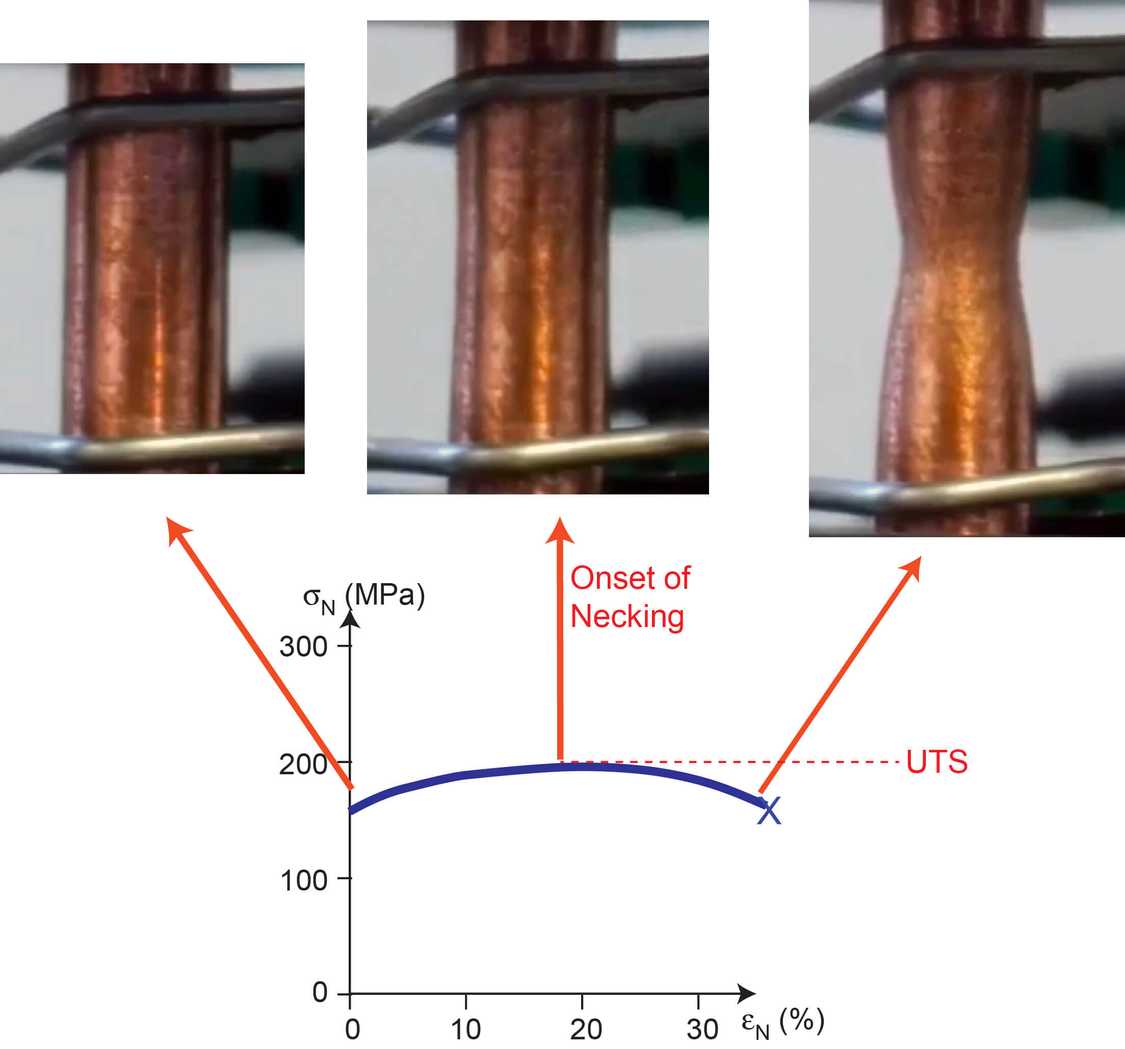
Necking starts when the plot of nominal stress against nominal strain reaches a maximum (plateau) – see Fig. 3. This is not always easy to identify in terms of the strain at which it occurs, since it is commonly a rather flat plateau, but the stress level is usually fairly well defined. In fact, this stress level is often regarded as important, and is commonly termed the ultimate tensile strength (UTS). It should be understood that this value is not actually the true stress acting at failure. This is difficult to obtain in a simple way, since, once necking has started, the (changing) sectional area is unknown. Also, the “ductility”, often taken to be the nominal strain at failure (usually well beyond the strain at the onset of necking) does not correspond to the true strain in the neck when fracture occurs. UTS and ductility values therefore provide only rather loose indications of the strength and toughness of the material. Nevertheless, they are quite widely quoted. In fact, provided the plasticity characteristics of the metal have been established (in the form of a true stress v. true strain relationship), it is possible to obtain the point at which necking will start, simply by converting true to nominal values and identifying the peak of this curve. This gives the UTS and also the strain at the onset of necking. It’s not possible to predict the curve for the regime in which the neck develops and fails, but this is in any event fairly meaningless (and depends on the gauge length).