In this blog post, we explore the difference between hardness testing and PIP testing, and explain why PIP testing provides a more complete picture of a material's mechanical properties compared to hardness testing.
When talking to potential customers we are often asked to explain the difference between hardness testing and indentation plastometry testing (which we refer to as PIP testing). In fact, we often tell people that PIP testing is "similar in execution" to hardness testing, but our indentation plastometers do not routinely measure hardness numbers. They can measure a Brinell hardness, but our indentation plastometers offer much more value than a simple hardness test machine because they measure something much more meaningful, more important, and more useful than a hardness number. They measure stress-strain curves.
What are the differences between a hardness number and a stress-strain curve?
Let's start with a description of the true stress-strain curve and its two primary features. We can then explain the concept of a hardness number with reference to these features.
A typical true stress-strain curve is shown in Fig. 1. The yield stress is indicated with an arrow. This corresponds to the stress at which permanent (irreversible) plastic deformation occurs (such that the material will no longer return to its original shape when unloaded). In ductile metals (i.e., those that aren’t brittle) large plastic strains can be tolerated. This is a regime of “uniform plastic straining” where it is typically observed that the material “hardens” or becomes more difficult to “stretch”. This process is known as “work-hardening”. The mechanistic reasons for work-hardening are well understood and are related to the interaction and entanglement of certain types of defects in metals (called dislocations) that mediate plastic deformation (beyond the scope of this article). The stress-strain curve is, therefore, a representation of the “strength” of the material, which in many ways is associated with the onset and progression of plasticity.
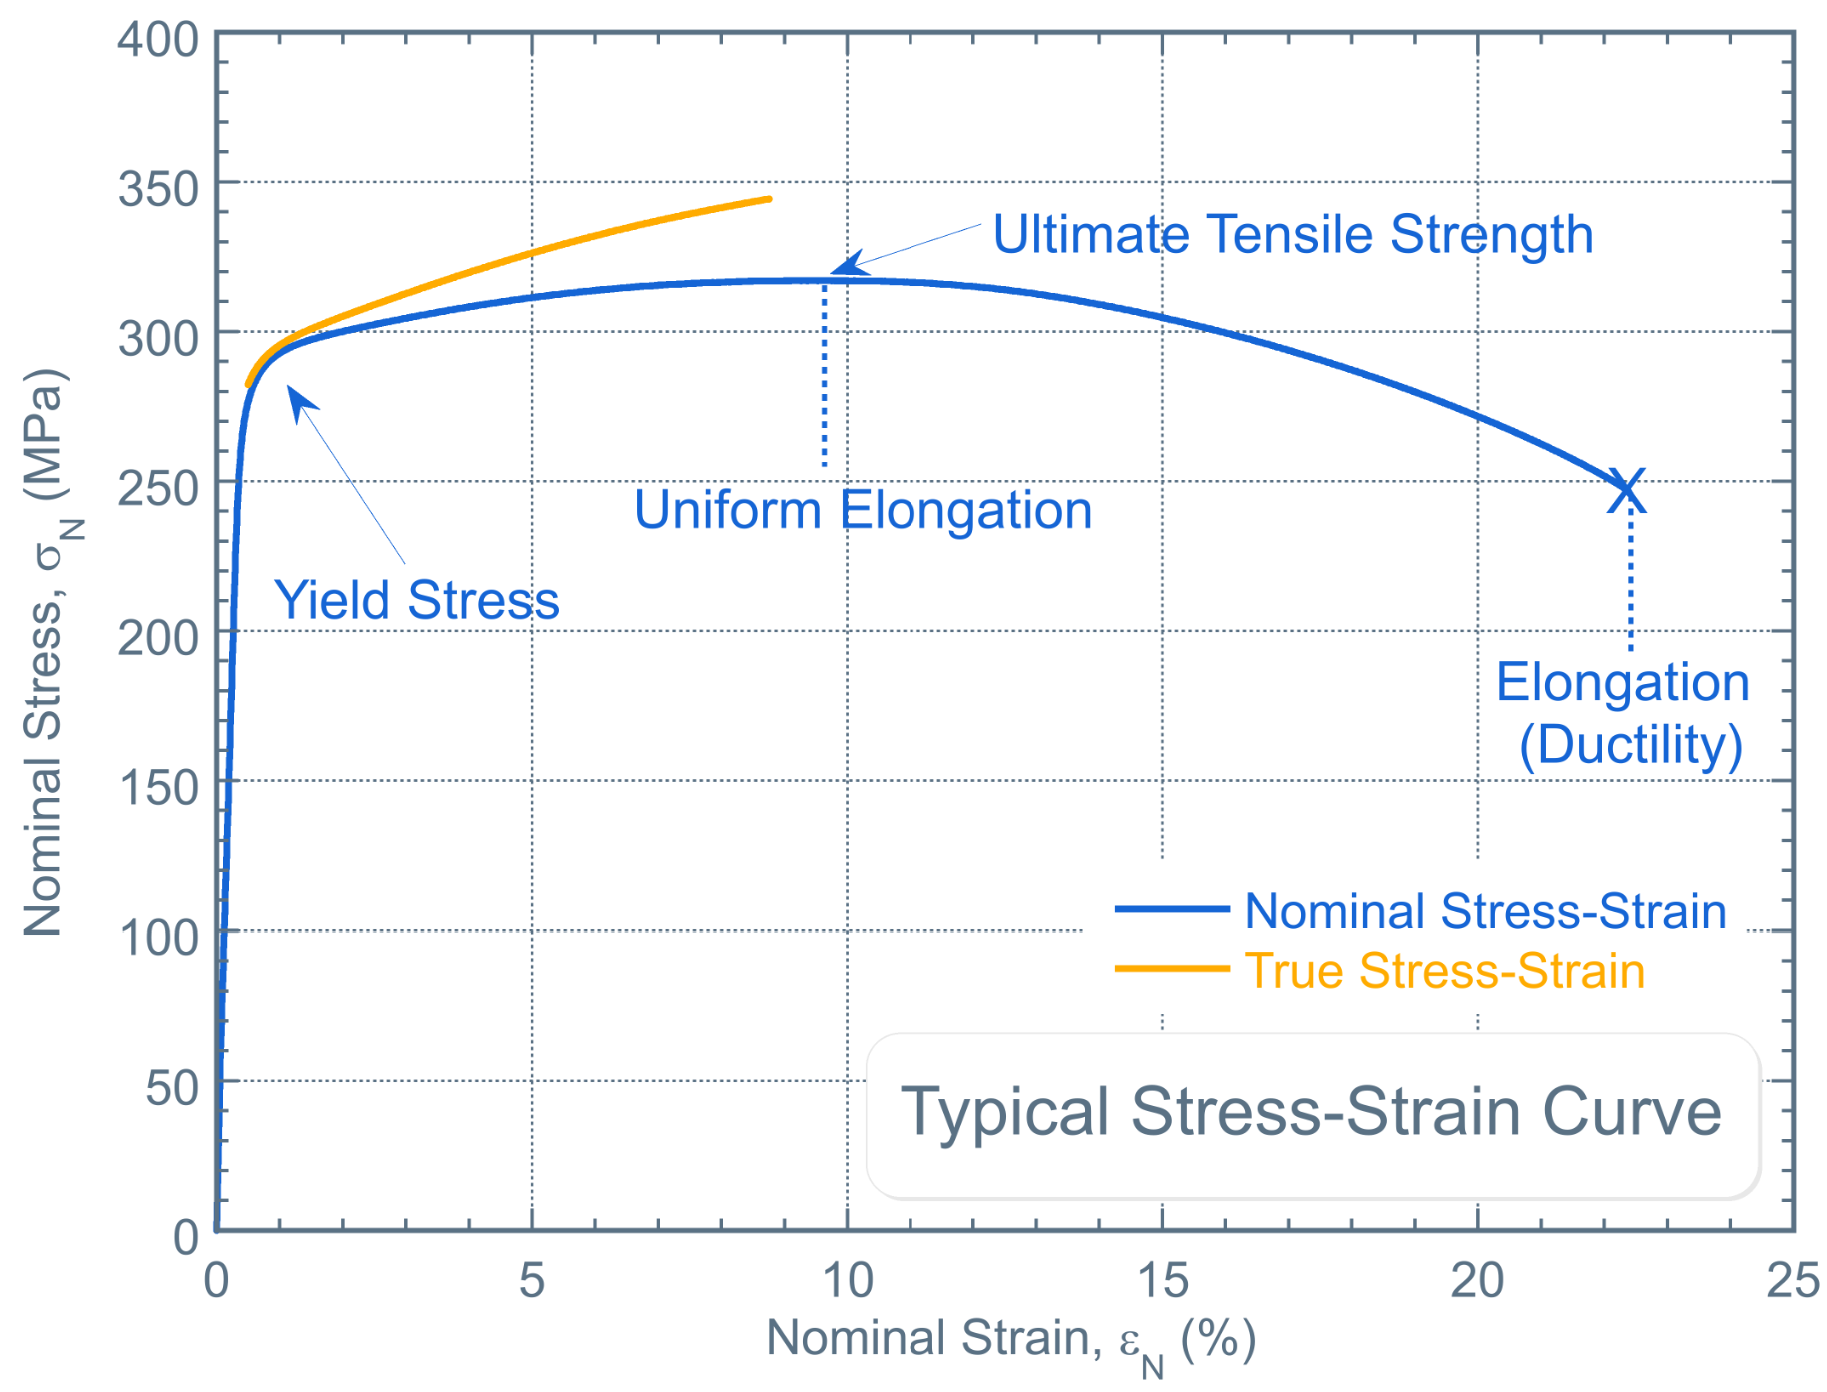
A representative true stress-strain curve with its corresponding nominal stress-strain curve, along with annotations showing the location of the yield stress
A hardness number is not a stress-strain curve, although it does depend on the stress-strain curve. It is a measure of a material’s resistance to plastic deformation. During a hardness test, a “hard” indenter is forced into the surface of a “softer” material. As the indenter penetrates the material, complex fields of stress and strain develop. There are regions beneath the indenter experiencing stresses below the yield stress. There are also regions of material experiencing stresses above, but close to, the yield stress, and there are regions of material that are experiencing stresses that are significantly higher than the yield stress following different degrees of work hardening. What is happening beneath the indenter is therefore difficult to interpret (at least intuitively) but what is clear is that a hardness number, expressed as the peak applied force divided by the projected indent area, must be an amalgamation of the yielding and work hardening characteristics. It is therefore dependent on the underlying true stress-strain (or plasticity) behaviour, but in a way that is not very easy to define.
Why are stress-strain curves "more meaningful", "more important", and "more useful" than hardness numbers?
A hardness number is not a fundamental material property. Hardness tests into the same material generate different hardness numbers if the tip shape and/or peak applied load are changed. This is not true of the yield stress, for example, which is the same no matter how you choose to measure it (tensile test, bending test, indentation plastometry test). Hardness numbers can’t therefore be used in engineering design calculations, or component life extension calculations, or finite element models. They can only be used in a semi-quantitative way to rank materials. Moreover, using hardness numbers as a proxy for the strength of a material can be misleading at best and dangerous at worst.
Can hardness numbers be related to elements of the stress-strain curve. The yield stress, for example, or the ultimate tensile strength?
For materials that exhibit little or no work hardening (which is likely to include materials containing significant levels of prior plastic strain), then the yield stress of a material is loosely related to the Vickers hardness of the material in the following way:
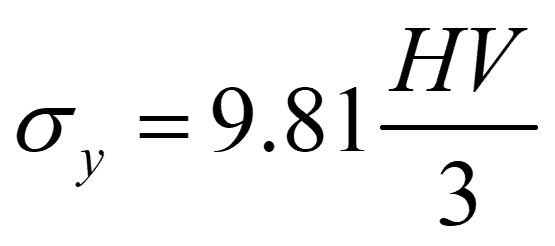
Where HV is the Vickers hardness and 9.81 converts the units into MPa from kgf mm-2. The correlations are often weak, however, so caution must be exercised. The same is true for correlations between hardness numbers and the ultimate tensile strength, or UTS. The UTS is the peak stress reached in the tensile nominal stress-strain curve. It is often said that this is the maximum stress that can be accommodated in the material, but this is not actually true. There is actually no such thing as a “nominal stress” in anything other than a uniaxial tensile test, and even then the UTS is not actually equal to the true stress in the material at that particular level of plastic strain. These details are beyond the scope of this article, but further information can be found in the more detailed review of the differences between true and nominal stresses available here. Nevertheless, there are some empirical relationships relating hardness numbers to values of UTS (albeit loosely and with pronounced scatter) but there is no universal relationship and caution should be exercised.
How do you get a stress-strain curve from a PIP test?
The scientific methodology underpinning Indentation Plastometry (or PIP) testing is conceptually very simple. The technique uses an inverse finite element method, whereby an experimental indentation test is simulated using a simple finite element model. Since indentation tests into metals lead to the creation of permanent impressions, it is necessary for the finite element model to incorporate an elastic-plastic material model – namely a true stress-strain curve! Such curves can be represented by simple expressions, such as the one developed by Voce:
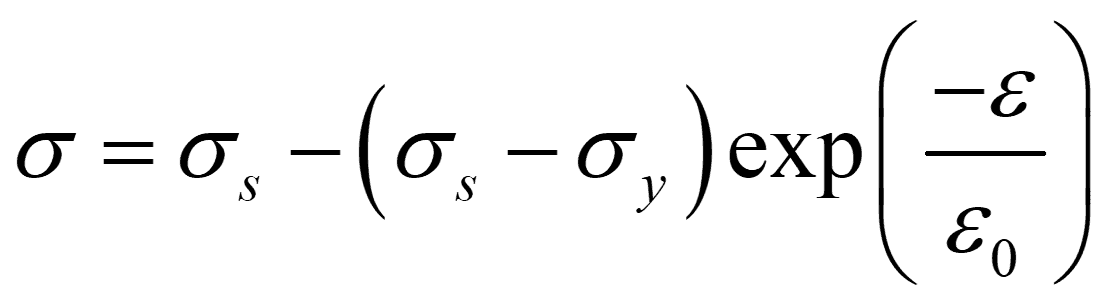
The Voce law contains three parameters that uniquely describe the shape of the true (plastic) stress-strain curve. These parameters, in the case of indentation plastometry, are initially unknown, but include the yield stress plus some additional parameters describing the work-hardening behaviour. It is then a simple matter to repeatedly change these parameters and re-run the finite element model until the experimentally measured and predicted residual profile shapes converge on one another. In our software package, CORSICA, we have implemented a number of experimental and computational test protocols that facilitate very fast convergence on these three parameters.


